
PERFORMANCE ANALYTICS BUILT FOR GOVERNMENT WORKFLOWS
Turn workflow data into measurable improvements.
Track KPIs, monitor workload trends over time, identify bottlenecks, and share leadership-ready reports—without manual spreadsheets. SimpliGov Performance Analytics gives agencies real-time visibility into workflow performance so teams can improve service delivery, reduce delays, and communicate results with confidence.
Improve Service Delivery
Track turnaround times, backlog trends, and workflow volume so you can reduce delays and deliver faster, more consistent service to residents and staff.
Measure KPIs & Identify Bottlenecks
Monitor key performance indicators like average processing time, completion rates, and task aging to pinpoint what’s slowing down work and prioritize improvements.
Reduce Manual Reporting
Replace spreadsheets and time-consuming reporting with automated dashboards and exportable reports for leadership, audits, and stakeholder updates.
See Performance Analytics in Action
Get a live walkthrough of KPI dashboards, workflow tracking, and exportable reporting built for government teams.
Get real-time visibility into your live transactional data.
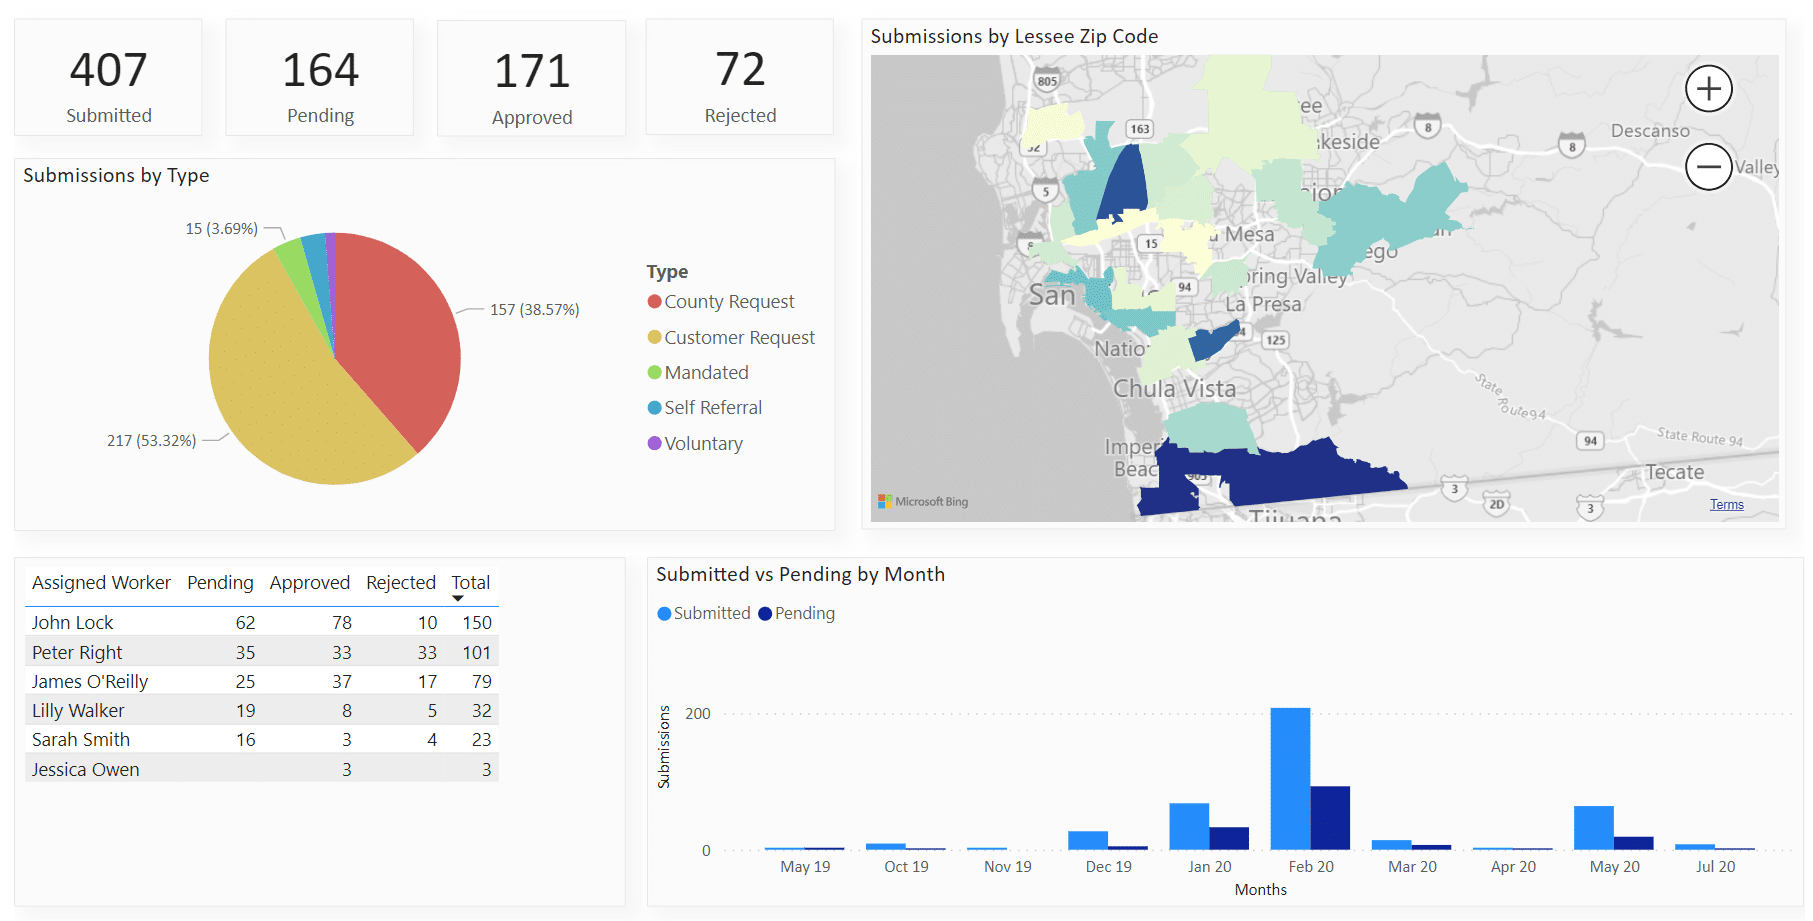
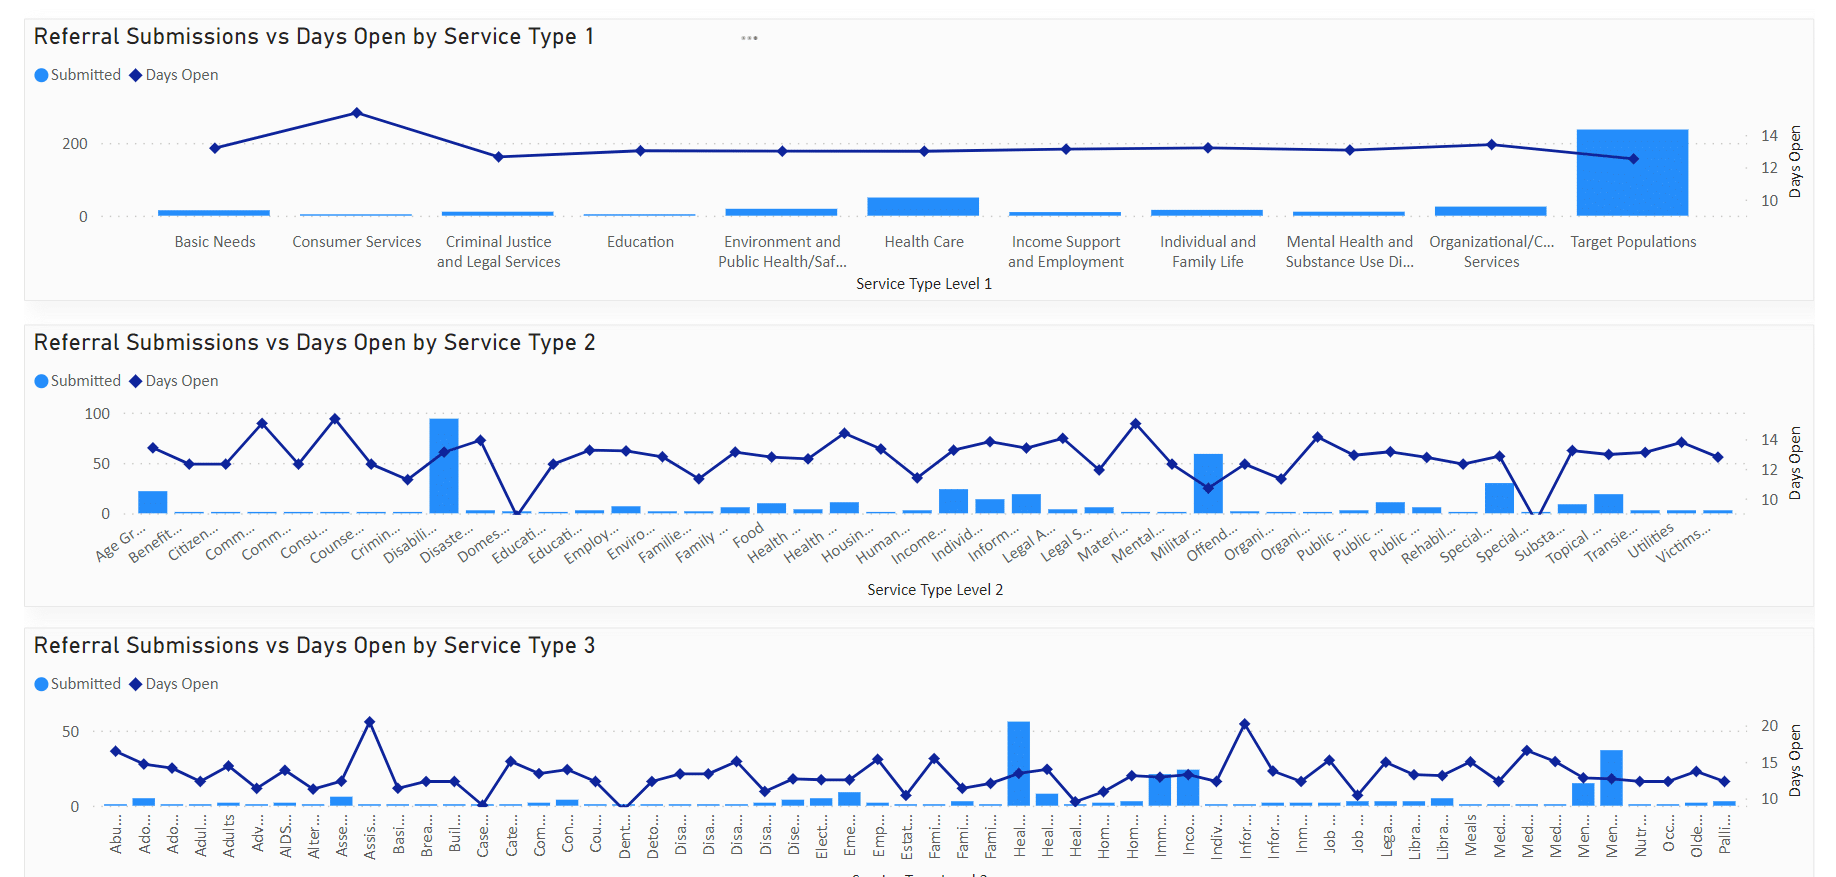
Enhanced visualization tools present live KPI dashboards that help decision-makers monitor workflow performance and communicate results clearly. View status, utilization, overdue tasks, and other key metrics across one or many workflows.
What you can track:
processing time and turnaround time
completion rates and volume trends
overdue tasks and aging work
bottlenecks by step, team, or department
Make faster decisions using dashboards that show what’s working—and what’s slowing teams down.
Customize reporting to fit your agency.
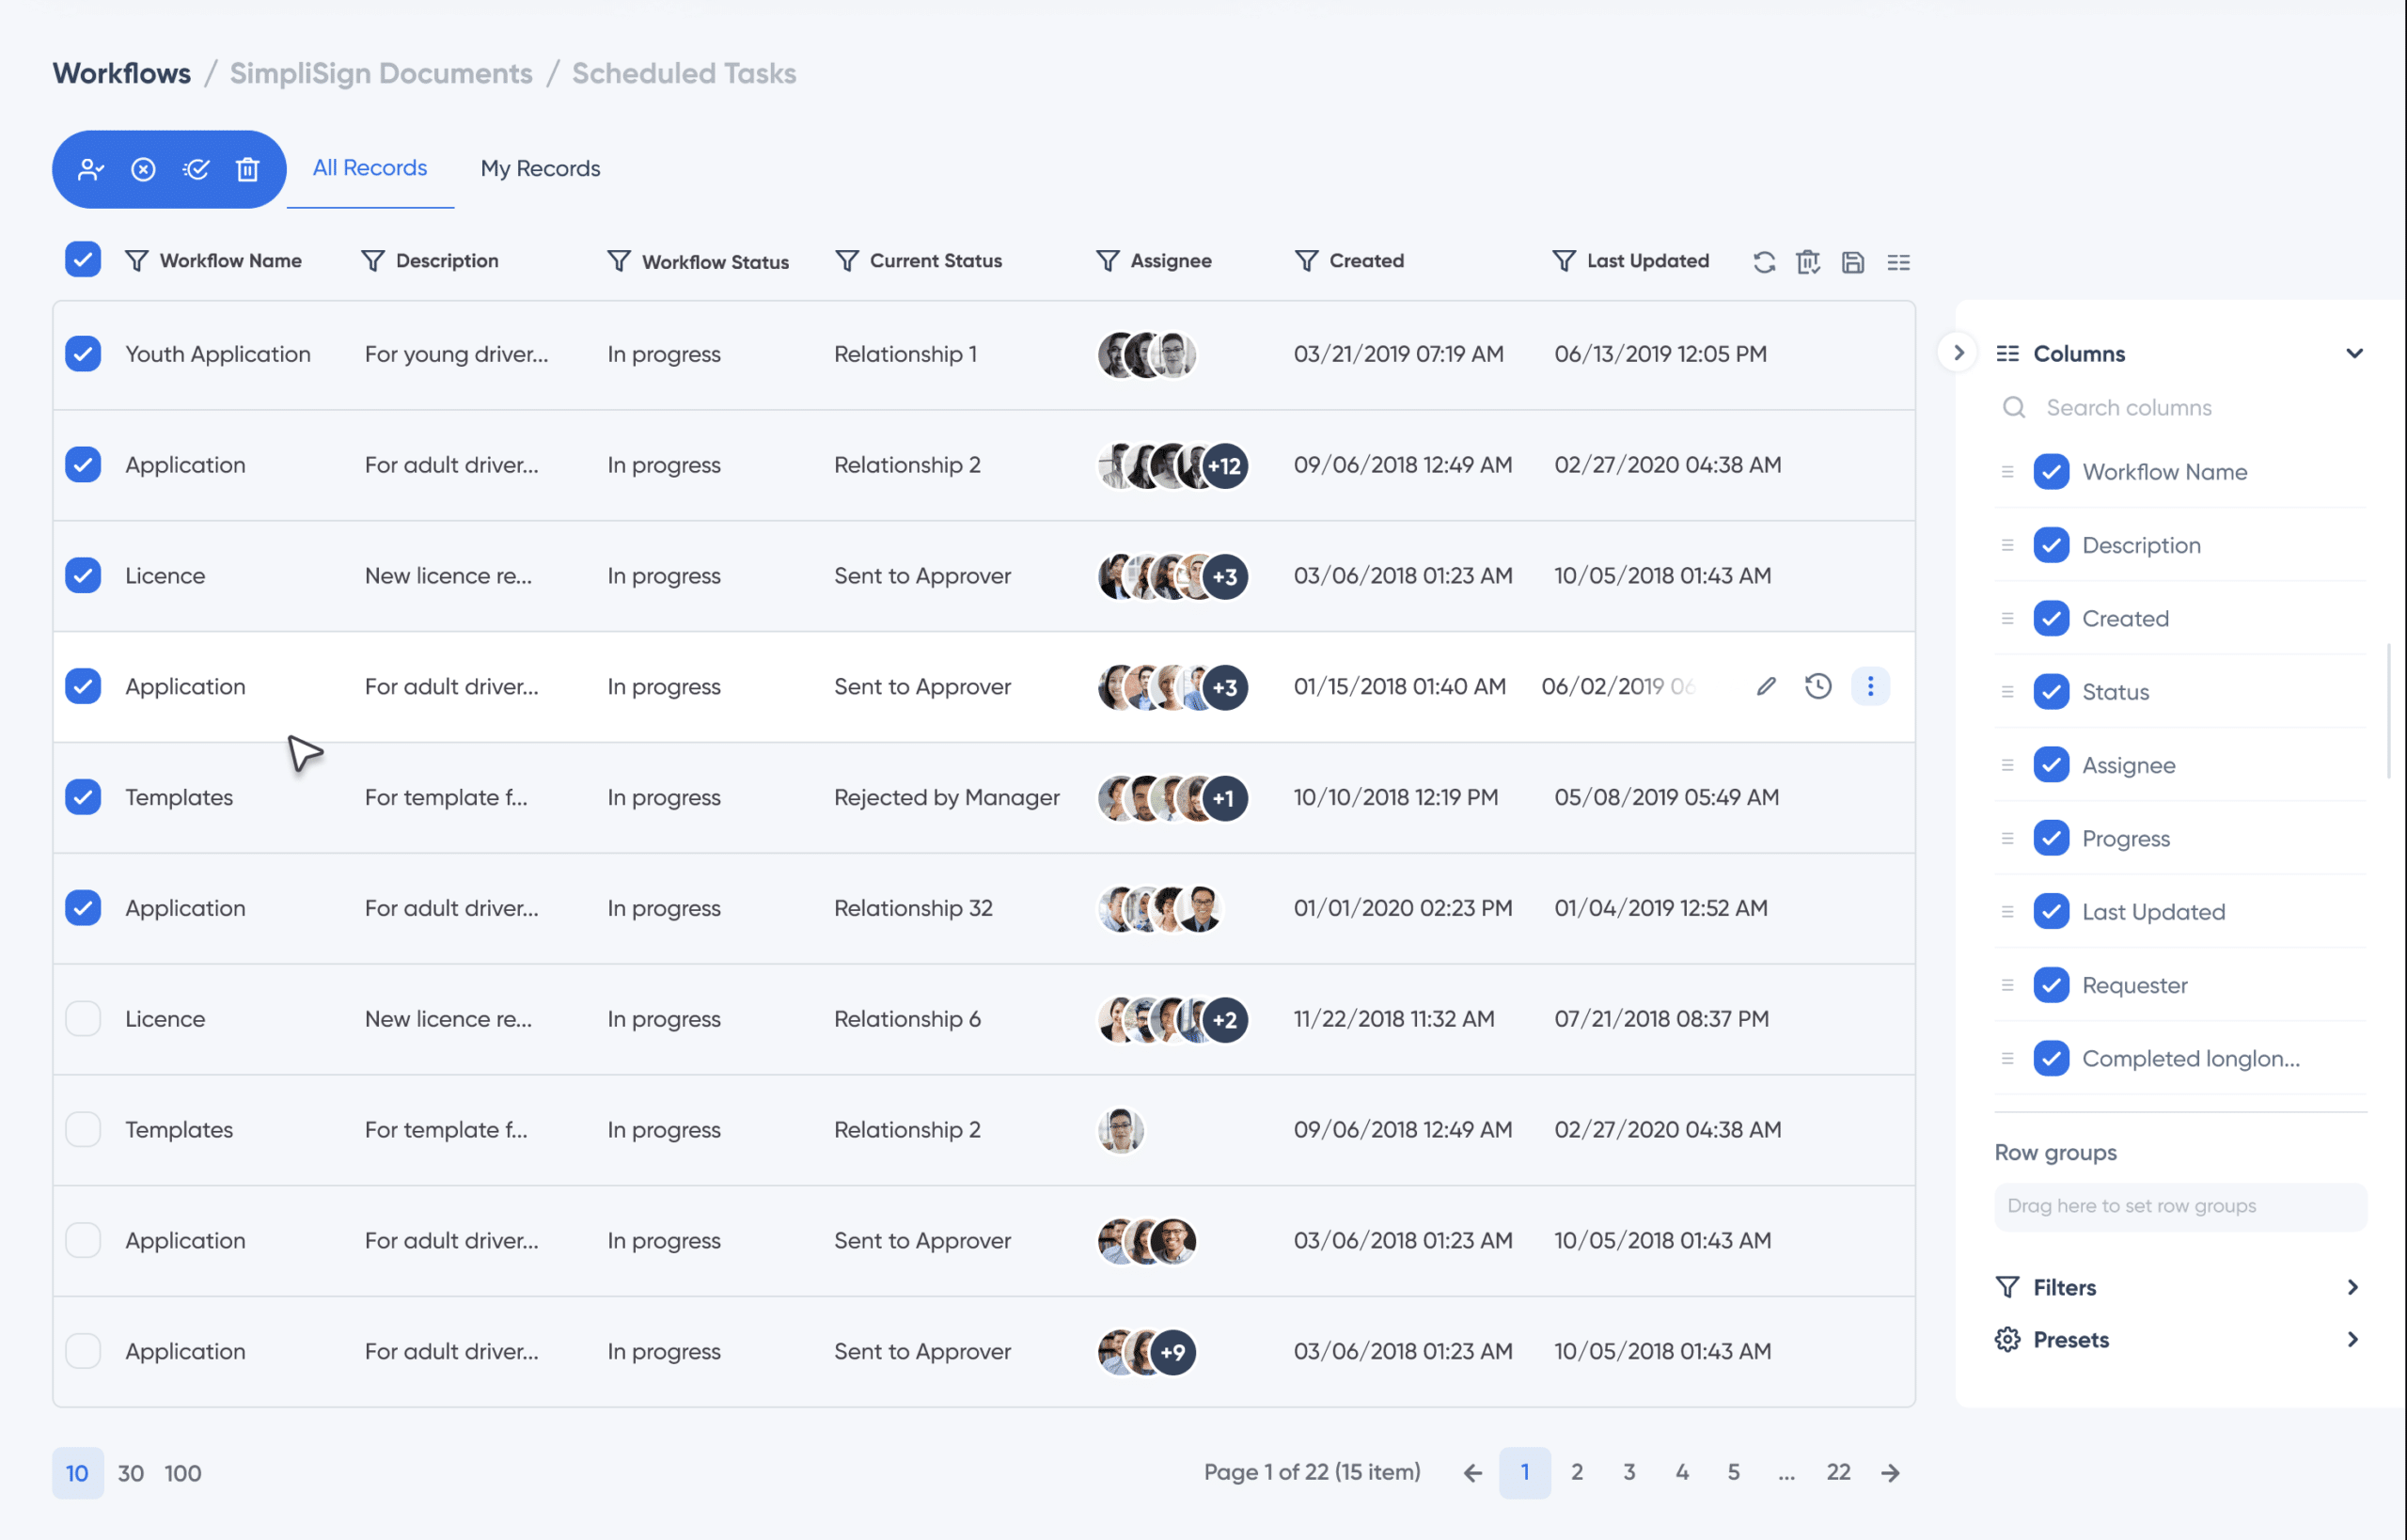
Reporting on your data should have no limits. Customize standard reports or design your own using tables, charts, pivot tables, and filters. View performance at the workflow level—or roll up results across programs.
Includes:
flexible report formats (tables, charts, pivots)
custom filtering and saved views
dashboards for different roles and departments
Build reports that match how leadership wants to see results—without manual rework.
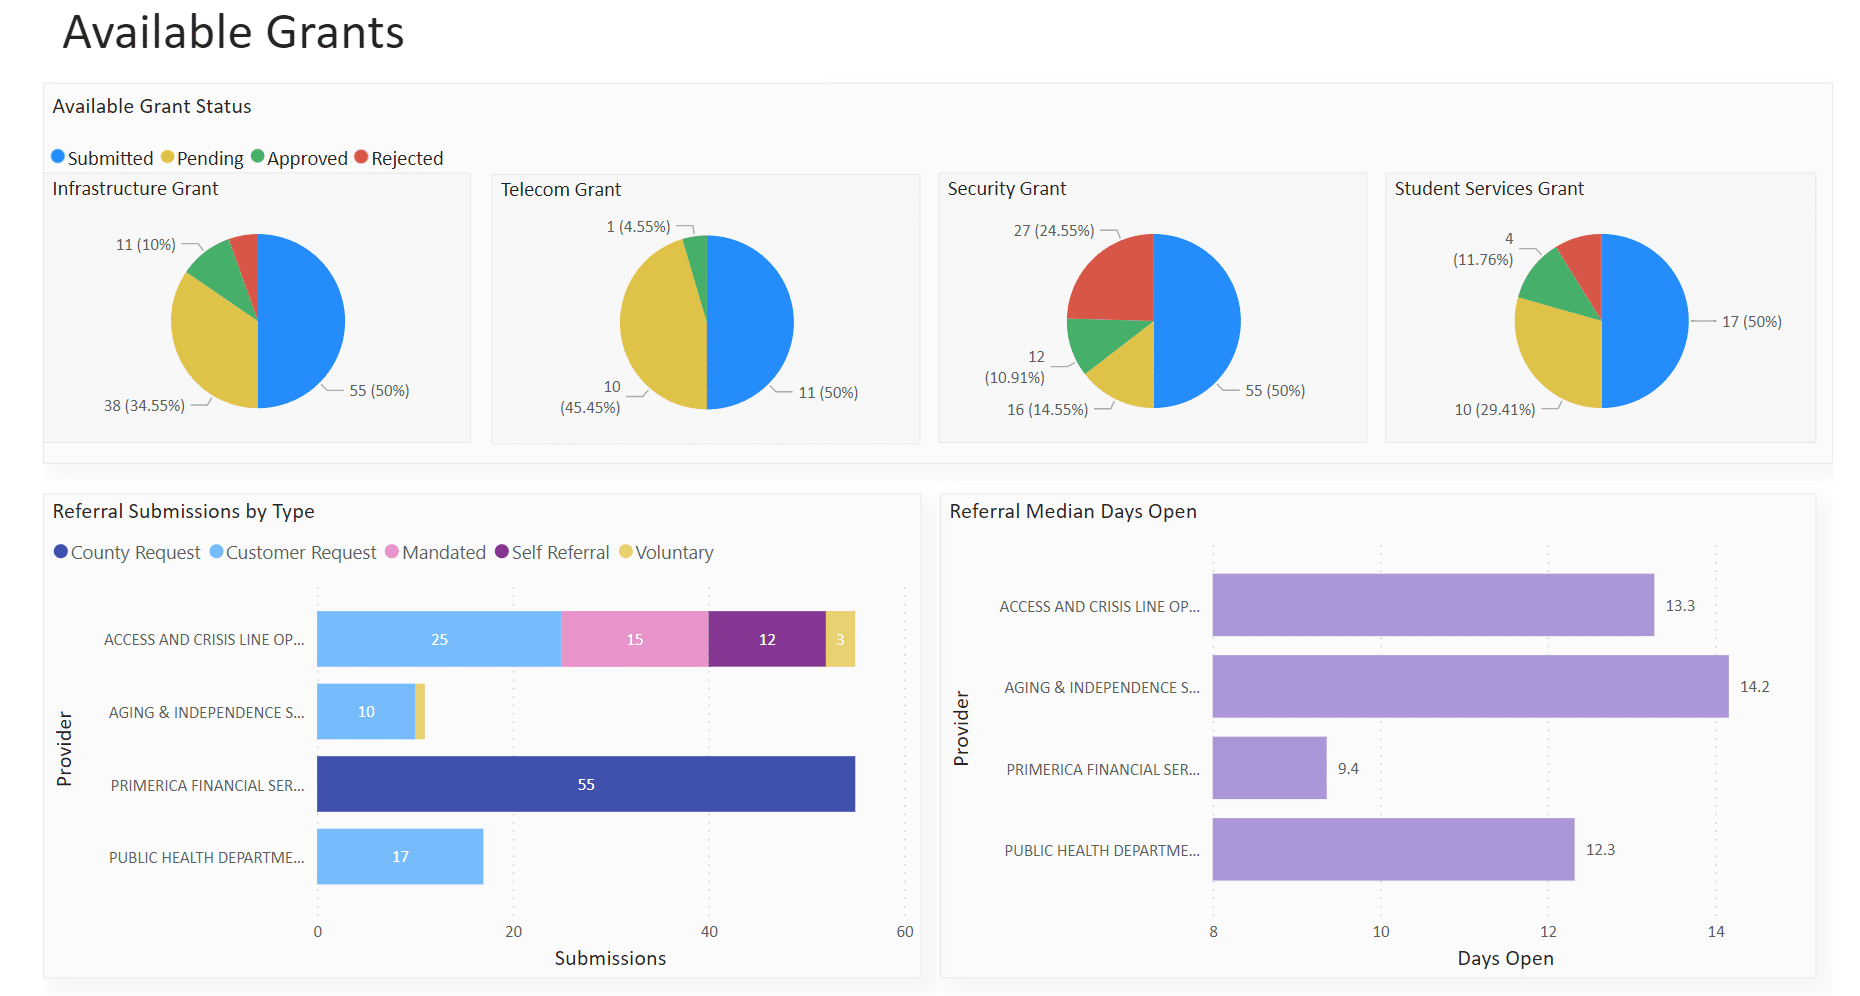
Export and share reports for leadership, audits, and stakeholders
Generate exportable reports to support leadership updates, audits, grant reporting, and internal performance reviews. Share consistent data with confidence and reduce time spent building recurring reports.
Includes:
export reports into multiple document types
repeatable reporting for leadership and compliance
audit-ready historical visibility
Replace spreadsheet reporting with automated dashboards and shareable outputs.
Integrate analytics with internal BI tools.
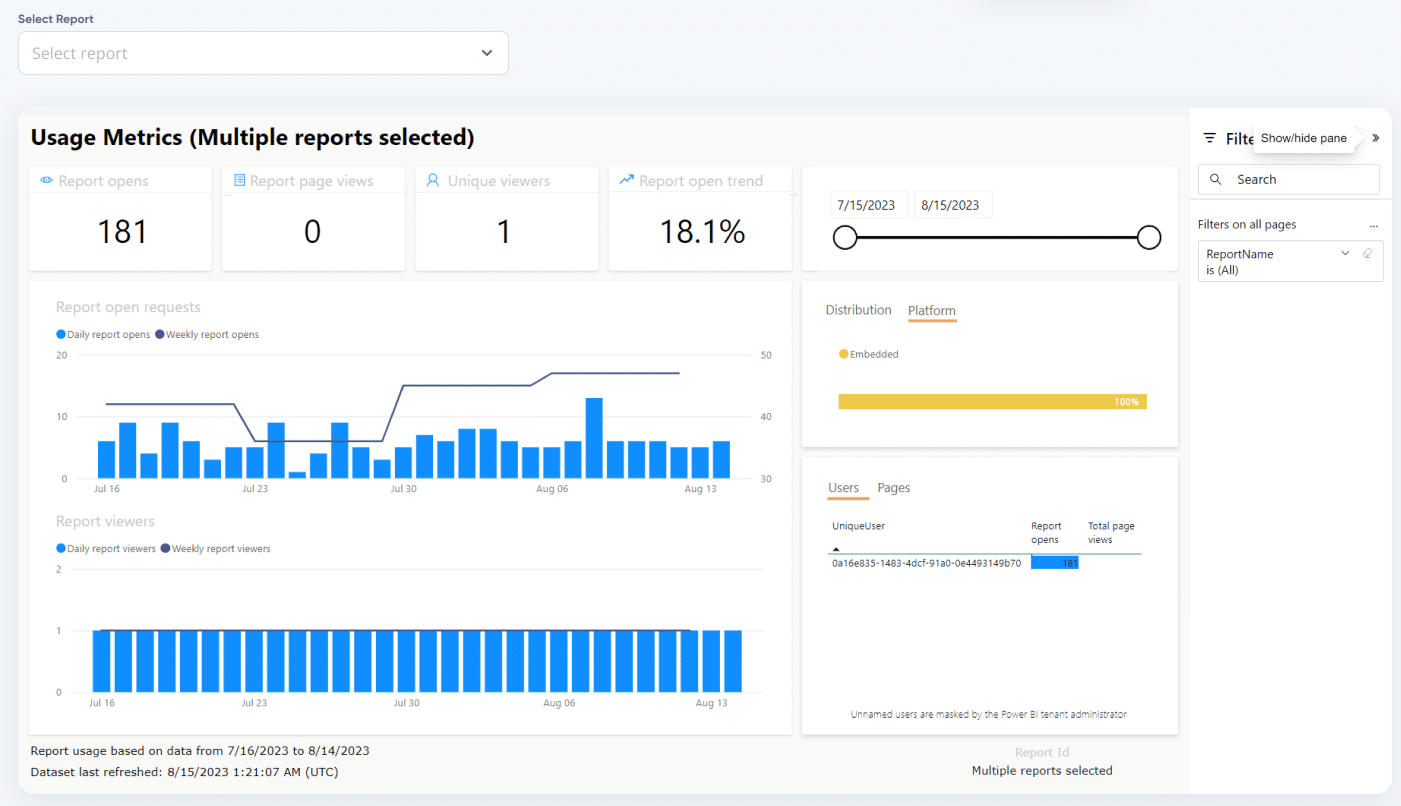
Integrate performance data with internal Business Intelligence platforms (such as Microsoft Power BI), or use SimpliGov data APIs to download data on a scheduled basis. Measure historical trends, identify improvement opportunities, and keep leadership informed through recurring reporting.
Connect workflow analytics to existing data and BI environments for deeper insight and agency-wide reporting.
Frequently Asked Questions About Performance Analytics
What is performance analytics?
Performance analytics helps teams measure workflow performance using KPIs and dashboards, including processing time, backlog volume, and completion trends.
How does performance analytics help government agencies?
It helps agencies reduce backlogs, improve turnaround times, allocate staff more effectively, and report outcomes to leadership with accurate data.
What KPIs can I track in SimpliGov Performance Analytics?
Agencies can track metrics such as average processing time, workload volume, aging tasks, completion rates, and other workflow-specific performance measures.
Can I export reports to share with leadership?
Yes. Reports can be exported and shared to support leadership reporting, audits, and stakeholder communication.
Is performance analytics included in the SimpliGov platform?
Performance analytics is part of the SimpliGov platform and works across workflows, providing consistent KPI reporting and operational insights.