If you were to give government employees truth serum, they might admit that they have a love-hate relationship (or worse) with reports. Sunshine laws, compliance reporting requirements, and audit preparation make reporting an essential part of government agency operations, but the job is also associated with red tape. In a previous era, it could take hours, days, or even weeks to comb records for a single piece of information, aggregate the full picture around a specific category or program, or otherwise derive deeper insights from raw data.
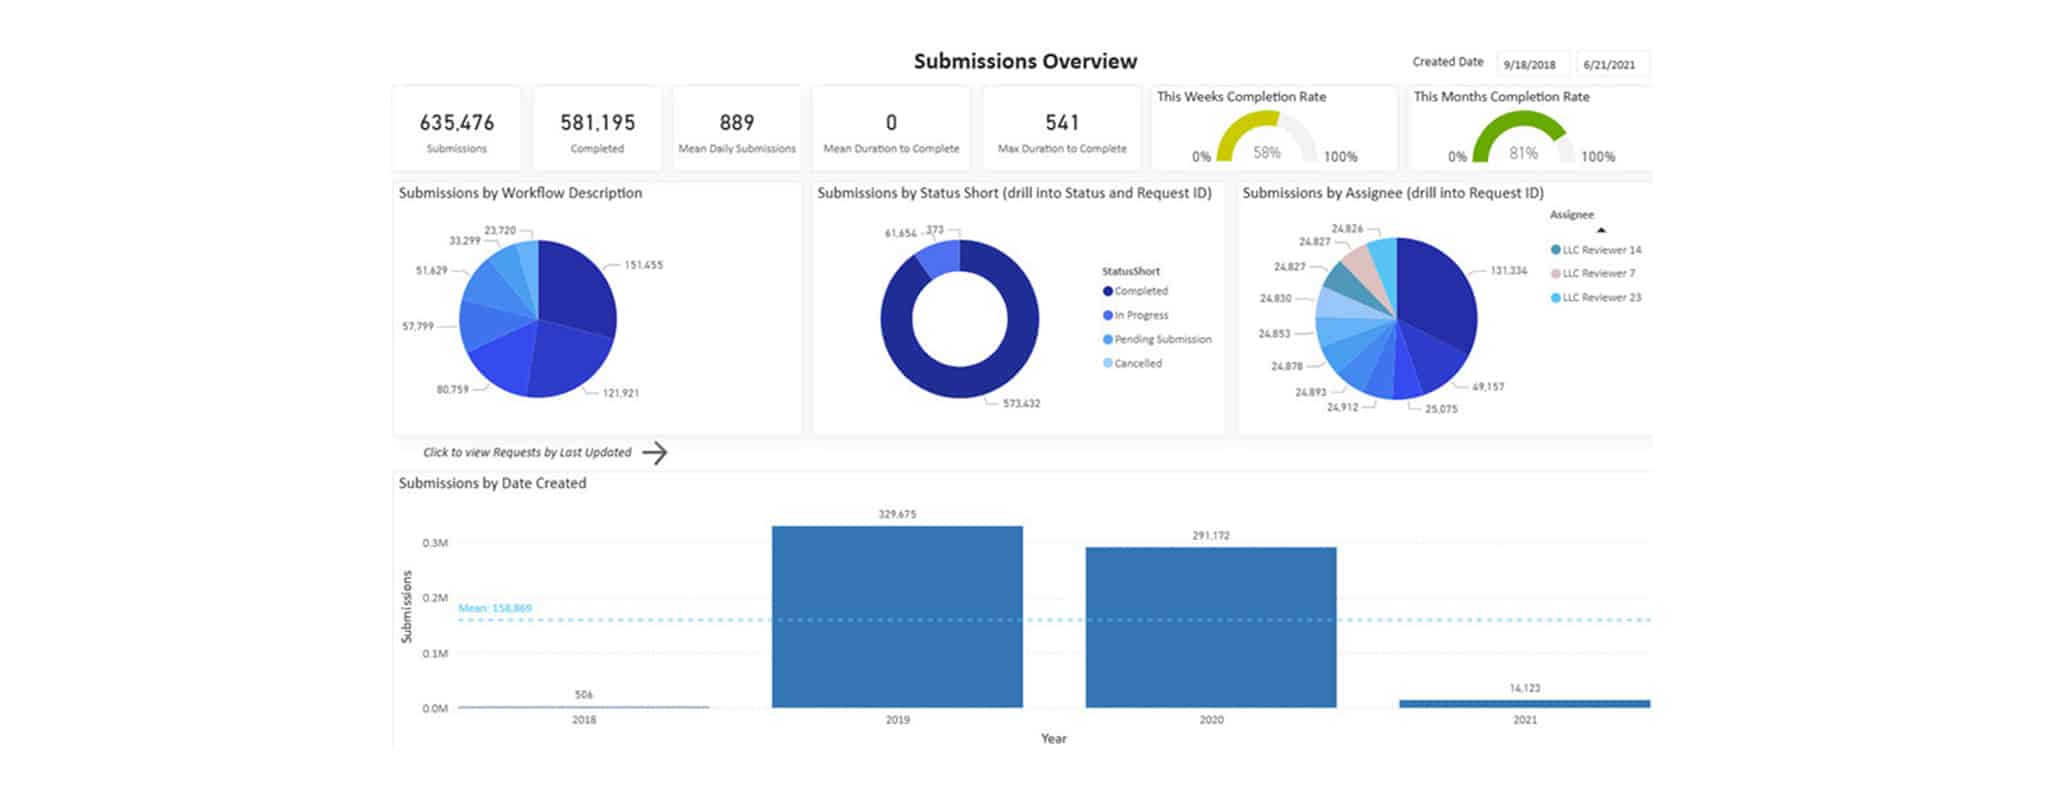
However, modern government forms and workflow automation platforms put supremely organized reports and profound intelligence at agencies’ fingertips with just a few mouse clicks. Users can glimpse one field or apply a set of filters to several via an intuitive dashboard and—voila!—have a ready-made account of program activity for legislators, chief executives, or department heads in seconds.
Here are six broad ways public entities are utilizing advanced reporting and analytics capabilities to improve their operations.
- Drill Down into Government Data Categories and Fields
- Track Program Changes and Evolution
- Streamline or Replace Spreadsheets
- Workflow Platform Evaluation
- Attain Demographic Analytics Insights
- Process Improvement
One of the most basic reporting functions, laying out data associated with a particular field or category, is arguably the most important one. If HR wanted to see every salary resolution amendment, if legal sought to review all MOUs, or if procurement would benefit from viewing each contract or purchase associated with a specific good, service, or purchase code, these departments could whip up a compilation of every transaction on a dime using digital government forms and reporting and analytics tools.
These reporting features are just the beginning of the deeper insights that can be mined from the data collected in digital forms and immediately reproduced for higher-ups.
This doesn’t necessarily mean reports around a specific variable are static. HR could further slice and dice those salary amendments by employee, department, or date. Legal might want to filter out nonprofits, grant recipients, or service providers who signed MOUs in August. Procurement often wants to ascertain the total number or aggregate dollar amount of all transactions within a spending category.
Audit reporting and audit trails are a couple of the most valuable features of a government forms and workflow automation platform, for pinpointing who made a decision, retracing where an applicant was given incorrect information, or identifying key developments with a program. Without an instantly producible, searchable chronology of activity, combing physical records or analyzing a year’s worth of files manually to see how activities evolved could easily take days or perhaps weeks.
Using PowerBI, agencies can automatically reproduce every change that occurred with a particular field or set of fields. For example, if an HR department wants to see every job status change made in a given time period, a report can highlight all of the promotions, demotions, transfers, and job title and description edits in distinct colors. Similarly, if a department wanted to know why it was suffering insufficient in-person coverage on Fridays, employees can pull up all of the staffers who were recently granted the option to telework at the end of the week.
The SimpliGov platform can work wonders with Excel files, Google Sheets, and other spreadsheet programs. It not only can pull data from CSV files to populate forms, it can also create reports directly from those same data sources, turning manual spreadsheets into data visualization and advanced reporting software for government. Agencies could convert a series of cells that make up a schedule for conference centers, pickleball courts, or park spaces into pie charts or graphs illustrating the number of reservations per activity or in each day of the week. DMVs could similarly visualize a breakdown of automobile registrations—by zip code, make, model, or class of vehicle.
Although PowerBI is generally used to take a snapshot in time, we have seen municipalities preprogram automatic daily or weekly refreshes to ensure that recipients have the most current data in hand at any moment.
Reporting capabilities go well beyond a particular workflow or department. They are instrumental in assessing the utility of the entire forms-workflow platform and supporting digital transformation in government. IT, administration, city manager, and county commissioner offices can quickly view which workflows are the most active (i.e., the ones that generate the most records or submissions). Similarly, agencies can start to ask questions about why certain workflows are underutilized. In essence, technology heads, senior leaders, and purse-string holders can get a bird’s-eye view of how much each department or office leverages digitized services and back-office administrative procedures.
Equally important, those responsible for optimizing the platform can survey how the creation and maintenance of workflows is proceeding. At-a-glance looks at the number of new business processes under construction, the average time it is taking to create a workflow, and how many days have elapsed since existing ones have been updated are also on demand for authorized users.
Some of the most common government program reporting efforts center around constituent-facing programs, namely who is using these government services. We have seen instances, especially with federal grants, where municipalities have been anxious to see the breakdown of awards by zip code or neighborhood. Many states, cities, and counties offer grants from their own general fund, too. Basic reporting on initiatives funded through their own taxpayer dollars can inform elected officials and government staff on their constituency’s priorities from year to year, whether it be food assistance, healthcare, housing, or small business aid, for example.
For agencies concerned about diversity, equity, and inclusion goals, it helps when any employee can pull up statistics showing program participation by race, ethnicity, or gender.
Do citizens often apply for multiple services? Agencies can, and often do, use reports to identify duplicate applications, determine which applications were accepted, or see which were processed first.
The savvier state and local governments quickly discover how to leverage performance analytics and reporting functionality to diagnose areas of improvement with their processes. A rapid dissection of why applications were rejected might reveal issues on your end. Were there discrepancies between the names on the application and what is listed in your database? Did an inordinate number of citizens fail to upload photos, birth certificates, or other required documentation, strongly hinting at a glitch with file handling on your end? Similarly, a spike in rejected applications in a single day or week may indicate an error with newly introduced instructions or possibly deeper IT infrastructure–related problems.
The Bottom Line: Better Data, Better Government
Advanced reporting and government data analytics capabilities allow agencies to derive insights into their citizens, their back-end operations, and the workflows powering the processes. More important, this intelligence galvanizes municipalities to fix issues as they arise rather than making process improvement a monthly or quarterly endeavor.
Advanced reporting and analytics are just one way SimpliGov helps government agencies ditch the paper, move faster, and serve constituents better. By combining workflow automation, digital forms, and integrated analytics, agencies gain visibility into citizen engagement, program performance, and operational efficiency—all while reducing risk and building confidence.
Frequently Asked Questions (FAQ)
Is SimpliGov a reporting software? No. SimpliGov is a government forms and workflow automation platform. Reporting and analytics are included as part of the platform, supporting compliance, transparency, and operational efficiency.
How do reporting and analytics help government agencies? They provide real-time visibility into workflows, constituent engagement, and operational performance—helping agencies reduce manual work and improve accountability.
Why is data visualization important for government agencies?
Data visualization turns raw data into clear, actionable dashboards that help teams and leaders make faster, more informed decisions—supporting transparency and better service delivery.
Ready to see the full power of workflow automation in action? Contact SimpliGov today to schedule a demo and see how our platform—along with advanced analytics—can help you automate processes, save time, cut costs, and fix the paper mess.

